C2.4 Solve inequalities that involve multiple terms and whole numbers, and verify and graph the solutions.
Skill: Solving Inequalities and Verifying and Presenting Solutions Using Models and Graphical Representations
To facilitate the learning of the concept of inequality, it is important to provide students with activities that encourage them to analyze situations of inequality and to treat them algebraically. It is then essential to discuss with them the strategies used to analyze inequalities, emphasizing those that call on concrete and semi-concrete representations, and that focus on the meaning of the inequality rather than on the mechanical application of a procedure or tedious calculations.
The strategy of plotting solutions with a number line allows students to analyze an inequality using their sense of number, operations and symbol, and to find the range of valid values in an inequality situation.
Students need to consolidate these strategies, as they are the basis for a good understanding of the algebraic manipulations they will be taught in later grades, and can also use these strategies to solve simple equations.
Source: translated from Guide d’enseignement efficace des mathématiques, de la 4e à la 6e année, Modélisation et algèbre, p. 200.
Representing Solutions Using a Number Line
This strategy involves carefully reading the given inequality and replacing the variable to find the range of valid values. A table is used to find several values for the variable. Afterwards, the solution can be plotted on a number line.
Example
\(7y + 31 ≥ 78\)
- The first column in the table of values represents the number by which the variable y will be replaced in the algebraic expression \(7y + 31\).
- The second column in the table of values represents the solution of the algebraic expression when the variable y is replaced by the number in the first column.
\(7 (0) + 31\)
\(0 + 31\)
\(0 + 31 = 31\)
- The third column in the table confirms or refutes the validity of the value of the variable y.
Is \(31 ≥ 78\)? The answer is no.
| y | 7y+31 | ≥78 |
|---|---|---|
| 0 | 31 | no |
| 1 | 38 | no |
| 2 | 45 | no |
| 3 | 52 | no |
| 4 | 59 | no |
| 5 | 66 | no |
| 6 | 73 | no |
| 7 | 80 | yes |
| 8 | 87 | yes |
| 9 | 94 | yes |
| 10 | 101 | yes |
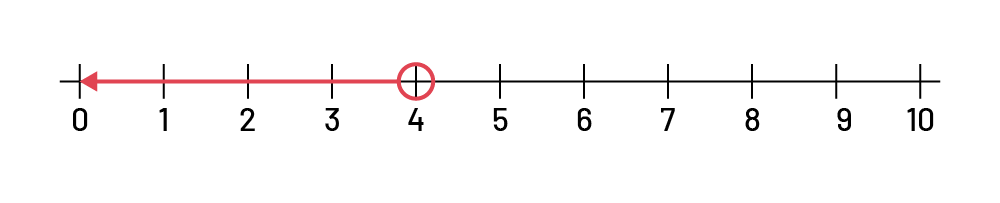
The range of valid values can be represented with a number line:

The solution is therefore \(y ≥ 7\).
Note: On a number line, an empty point indicates a strict inequality relationship ("is less than" or "is greater than"); a full point indicates a non-strict inequality relationship ("is less than or equal to" or "is greater than or equal to").
Once the student has solved an inequality, checking its solution by inserting that value into the original inequality is a great habit to get into.
Example
When solving the inequality \(5m - 4 < 2m + 8\), it is best to group like terms with a variable on the side where the coefficient is highest (most positive), in this case on the left.
We obtain \(m < 4\).
To check if the solution is true, we can replace the value of m by values near 4, for example 3, 4 and 5.
\(\displaylines{\begin{align} 5(3) - 4 &< 2 (3) + 8 \\ 15 - 4 &< 6 + 8 \\ 11 &< 14 \end{align}}\)
This is true.
\(\displaylines{\begin{align} 5(4) - 4 &< 2(4) + 8 \\ 20 - 4 &< 8 + 8 \\ 16 &< 16 \end{align}}\)
This inequality is false.
\(\displaylines{\begin{align} 5(5) - 4 &< 2(5) + 8 \\ 25 - 4 &< 10 + 8 \\ 21 &< 18 \end{align}}\)
This inequality is false.
Knowledge: Inequality
Relationship of order between two expressions or two quantities.
Inequality is represented by various signs including:
< (is less than);
> (is greater than);
≠ (is not equal to);
≤ (is less than or equal to);
≥ (is greater than or equal to).
Non-Equality
Relationship between two expressions or two quantities that do not have the same value.
Non-equality is represented by the sign "≠" (does not equal, does not equal).
Example
\(\begin{align} 5 &≠ 5 +1 \\ (3 \times 5) + 4 &≠ 3 \times (5 + 4) \\ 8a &≠ 25 \end{align}\)
Source: translated from Guide d’enseignement efficace des mathématiques, de la 4e à la 6e année, Modélisation et algèbre, p. 70.