C1.2 Create and translate repeating, growing, and shrinking patterns involving rational numbers using various representations, including algebraic expressions and equations for linear growing and shrinking patterns.
Activity 1: Different Representations
Materials
- Grid paper
- Coloured pencils
Give students an equation such as s = 3n + 2, and have them follow a set of instructions. It is important for students to be able to represent a pattern in different ways.
- Represent this pattern on grid paper, and clearly indicate the pattern core on your drawing.
- Represent the pattern in a table of values and clearly label variables used.
- Draw a graphical representation of the equation. What do you notice?
* Repeat the activity for an equation that represents a shrinking pattern.
Invite students to form teams so that they can compare their strategies and answers, providing feedback to each other. Repeat the same thing as a class to conclude.
Examples of strategies
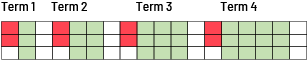
Example 1
Representation: s = 3n + 2; s: number of squares n: term number
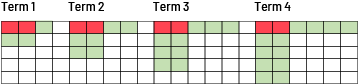
Example 2
Possible questions
- Compare the patterns. What do you notice? Point out the similarities and differences.
- Are the resulting relationships and rules identical? Equivalent?
Note: When simplified, the rules should be equivalent to \(s = 3n + 2\).
Activity 2: Let's Create Non-Linear Patterns
Materials: blocks, tiles, grid sheets, graphing software
Divide students into teams. Write the following instructions on the board:
- Create a non-linear pattern using any of the material provided.
- Represent your pattern using a table of values and a graph.
- Describe why your pattern is non-linear.
Discuss as a class. Ask some teams to present their representations.
Activity 3: A Pattern of Hexagons
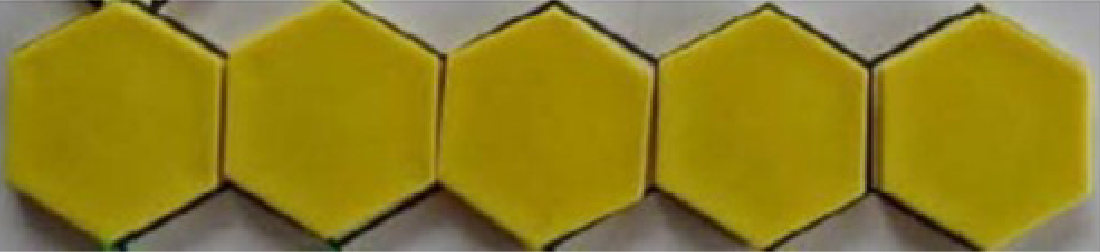
Project this picture on the board. Arrange students in teams and ask them to write an equation that can be used to calculate the perimeter, p, of a chain of n hexagons.
Next, have each team create a table of values in which one variable represents the number of hexagons, and the second variable represent the perimeter. Ask each team to also represent the relationship between the number of sides and perimeter using a graph.
Note: For students having difficulty, give clues as to which variables to use to find the equation.
Consolidate and compare students' strategies and answers. All equations that work should simplify to the same equation and graph.