C1. Patterns and Relationships
Identify, describe, extend, create, and make predictions about a variety of patterns, including those found in real-life contexts
Learning Situation: Movie Rental
Duration: 150 minutes
Summary
In this learning situation, students solve a real-life problem situation that develops the concept of relation. Students use a variety of strategies to determine a rule defining a given relationship and explain it verbally.
| Overall Expectation | Specific Expectations |
| C1. Algebra Identify, describe, extend, create, and make predictions about a variety of patterns, including those found in real-life contexts |
C1.1 identify and describe repeating, growing, and shrinking patterns, including patterns
found in real-life contexts
C1.2 create and translate growing and shrinking patterns using various representations, including tables of values and graphs C1.3 determine pattern rules and use them to extend patterns, make and justify predictions, and identify missing elements in repeating, growing, and shrinking patterns C1.4 create and describe patterns to illustrate relationships among whole numbers and decimal tenths and hundredths |
Learning Goals
The purpose of this learning context is to have students:- represent a relationship in different ways;
- communicate in words the rule that defines this relationship.
| Learning Context | Prerequisite |
| In the primary grades, students learned to identify and describe a pattern rule in a geometric sequence and in a numerical sequence. In Grade 3, they represent relationships using tables of values. In Grades 4 and 5, students also represent these relationships using a graph. | In this learning situation, students create and make connections between different representations.> |
To be able to complete this learning context, students must be able to:
- represent a pattern concretely or semi-concretely;
- represent a relationship between term number and term value using a table of values;
- determine a pattern rule;
- extend a pattern.
Appendix 5.4 (Optional Preparatory Activity: Geometric Growing Patterns) In this activity students consolidate their understanding of some concepts related to geometric growing patterns. Use this task to check if students have acquired the prerequisites for this learning task.
Materials
- interlocking cubes (about 1,000)
- Appendices 5.1A and 5.1B (One copy per team)
- bingo markers (one per team)
- Appendix 5.2 (One copy per team)
- Appendix 5.3
- Appendix 5.4
Note: The appendix does not fully represent the learning context. Teachers may wish to adapt it by mentioning that it is an online movie rental service.
Mathematical Vocabulary
Pattern rule, recursive relationship, functional relationship, relation, numeric pattern, geometric pattern, table of values.
Before Learning (Warm-Up)
Duration: 60 minutes
Review with students the various representations using the following situation.
Ask students the following questions:
- If Dimitri and Anouka rent five movies, how much does it cost them? Why do you think so?
- After renting 17 movies, how much will they have spent? What did you do to determine this amount?
Next, create a table of values with students that represents the relationship between the number of movies rented and cost (the dollar amount spent).

Have students analyze the relationships by asking questions such as:
- If you look at the row labelled "Number of movies rented" in the table of values, what do you notice? (From one column to the next, there is always one more movie than in the previous column, so the pattern rule is to add 1 each time; the recursive relationship can be expressed as "+ 1".)
- If you look at the row labeled "Expenses ($)" in the table of values, what do you notice? (From one column to the next, there is always $5 more than in the previous column. So the pattern rule is to add 5 to each term to get the next term and the recursive relationship can be expressed as "+ 5".)
- What relationship do you notice between the number of movies viewed and the cost? (The cost is always five times greater than the number of movies viewed.)
Tell students that the movie rental site offers a virtual loyalty card to its customers. Explain that the card earns one point for every dollar spent.
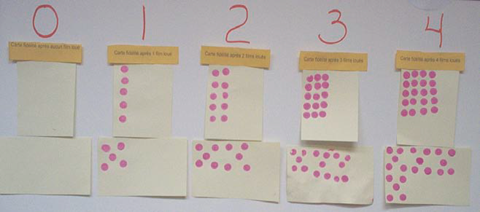
Show the class the loyalty card of a person who has not yet viewed a movie and those of people who have viewed one, two, three and four movies respectively. The picture below illustrates two examples of sets of loyalty cards representing the amount spent according to the number of films viewed. For example, after viewing a movie for $5, there are five points on the card, after viewing a second movie, there are 10 points on the card and so on.
Note: It is important to start the geometric pattern showing no movie rentals and highlight that some movie rental sites will require a subscription fee before a movie can be rented.
Guide students to verbalize a pattern rule by asking questions such as:
- How can you describe the points on a loyalty card of a customer who rented 12 movies?
- How much did this customer spend on this movie rental site?
- After renting 20 movies, how much will this customer have spent?
- What did you do to determine this amount?
- How can you determine the amount paid, regardless of the number of films rented?
Here is an example of how a student might express the pattern rule in everyday language: "After renting 20 movies, there will be 20 columns of 5, so 100 points on the loyalty card. Each point represents $1 spent. So, we always multiply by 5."
To help this student clarify their thinking and express their pattern rule more clearly, ask questions such as:
- What is multiplied by 5? (The number of movies rented).
- Multiplying the number of movies rented by 5, what do we get? (The amount spent).
The student can then express a more specific rule: "When I multiply the number of movies rented by 5, I get the amount spent."
Explain to students that when describing a quick way to determine the value of any term (for example, the amount spent) in a pattern, we are expressing a rule defining a functional relationship between the term number and the value of the term in the pattern.
Form teams of two students. Give each team a copy of Appendices 5.1A and 5.1B and read aloud the following situation:
Also read the questions in Appendix 5.1A and ensure that students understand the task at hand.
Note: Using a concrete representation enables students to rearrange the material to visualize the pattern. Most students will have no difficulty representing the pattern of accumulating points on a loyalty card for rented movies, but some will tend to forget to represent the number of points on the loyalty card with no rented movie. Have them recognize that a $4 subscription is required and that they must represent the points on a loyalty card with only that amount (when zero movies have been rented).
Invite teams to complete the task. Observe their work and provide support as needed. Pay particular attention to whether students create a geometric pattern that shows the increasing part of the pattern clearly.
If necessary, ask questions such as:
- Are the cubes (tokens, stamps…) always added in the same way and in the same order?
- What is similar about the pattern from one card to another?
- What is different from one card to another?
- What is the pattern rule for this pattern?
- How many points are awarded on the loyalty card when no movies are rented? How do you know?
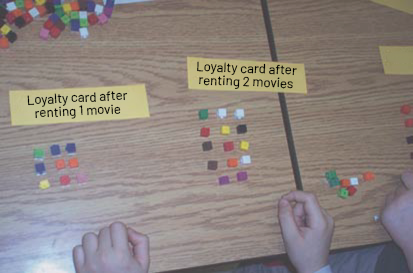
Here are some examples of student work.
- This team represented the amount spent after a movie rental, $9, by a group of four cubes and a group of five cubes. They then added five cubes to each of the subsequent showings. However, they did not place anything under the label "Loyalty card after 0 movies rented".

- This team simply counted out the number of cubes required to represent the amount spent, without regard to their arrangement. The addition of five cubes from one representation to the next cannot be easily identified, making it more difficult to describe the pattern rule that represents the relationship between the number of movies rented and the amount spent.
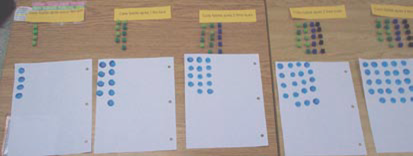
- This team structures the manipulatives to create a concrete geometric pattern and then replicates this using a bingo dabber. By translating the concrete pattern to paper this team is visualizing the make up of this pattern and will aid them in developing a rule to match this situation.
When teams have completed the task (Appendix 5.1A), ask some teams to post their loyalty card patterns. As a class, review the questions, checking the significance of the patterns posted.
Encourage students to compare the two movie rental sites and formulate a pattern rule for each situation by asking questions such as:
- What is the cost of renting five movies at each site? (At the first site, the cost is $25 (5 movies × $5) and at the second site, it is $29, because you have to add the $4 subscription cost).
- What is similar between the two sites? different? (What is similar is the $5 rental fee per movie. What is different is the presence or absence of a $4 subscription fee).
- How can we quickly determine the amount of money spent based on the number of movies rented at each site? (To quickly determine the amount spent at the first site, multiply the number of movies rented by 5, while for the second site, multiply the number of movies rented by 5, then add the $4 subscription fee).
Note: It is important to recognize that a pattern rule may be expressed differently by students depending on their perception of the relationship.
Active Learning (Action)
Duration: 70 minutes
Prepare the five scenarios below by recording the characteristics of each in the appropriate boxes on copies of Appendix 5.2 (New Video Club).
| Scenario | Subscription Cost | Rental Cost per Movie |
|---|---|---|
| 1 | $5 | $4 |
| 2 | $0 | $6 |
| 3 | $5 | $6 |
| 4 | $6 | $5 |
| 5 | $50 | $2 |
Present the following situation:
Give each pair of students a scenario. Make sure to divide the five scenarios among them. Explain the components of the report to be submitted to the company:
- an example of a pattern of loyalty card points corresponding to the rental of no movie, one movie, two movies, three movies and four movies, remembering to include the cost of the subscription if applicable;
- a table of values that represents the relationship between the number of movies rented and the cost;
- a pattern rule expressed in words that allows you to quickly determine the amount of money a customer has to spend based on the number of movies rented;
- a name for the new video club.
As pairs are completing the task, circulate and provide support as needed. Pay particular attention to how students organize the items (points) on the loyalty cards.
| Possible Observations | Possible Interventions |
| A team cannot organize the points on the loyalty cards. | Suggest that you first represent the situation with concrete materials.
Then ask questions such as:
|
| One team with Scenario 1 forgot to account for the cost of the subscription ($5) and represented only the cost of renting movies ($4 per movie rented). | Ask questions such as:
|
| A team with Scenario 4 organizes the dots without creating an observable geometric growing pattern. The quantity is respected, but the structure does not make it easy to see the addition of five points from one card to the next. |
Lead students to recognize that dots should be added in a specific way to make the pattern visible by asking questions such as:
|
| A team that has correctly represented the scenario fails to communicate a pattern rule in words. | Encourage students to analyze their representation of the scenario (table of values or the points on the
loyalty card pattern) by asking questions such as:
|
Have pairs post components of their report on a large sheet of paper (see Appendix 5.3 for sample reports). Assign each pair a presentation type to follow (see Types of Presentations below). Allow time for them to prepare their presentation. Once completed, have pairs post their reports on the classroom walls.
Consolidation of Learning
Duration: 20 minutes
Invite a few teams to take turns presenting their reports.
Types of Presentations
- Some teams may present their reports with explanations of their approach. Here are some examples of possible student explanations:
- When we received our scenario, we knew that for every movie we rented, there would still be an additional cost because there is a subscription fee.
- Since the rental cost is $6 per movie, we know that for each movie rented, we will have to pay $6 and add six points on the loyalty card.
- At the beginning, we put the dots in any way on the cards, then we realized that it was difficult to see the pattern. So we redid the cards and rearranged the dots to make it easier to see the growing pattern.
- Looking at our pattern of points on the loyalty cards, we notice the presence of a subscription fee and the addition of six points from one card to the next since, in our scenario, each movie costs $6.
Note: The student supports their explanations by showing the pattern of points on their the loyalty cards.
- Some teams may report with interpretive questions such as:
- Can anyone tell us how much it costs to rent a movie on this site?
- Among the sites displayed on the board, is there one that presents the same situation as ours? Which one and why?
- Can you tell us if this site requires a subscription? If so, what is the fee?
- Using the pattern visible on the loyalty cards or the table of values, who can tell us what the card would look like after 15 movies rented on this site?
- Can anyone explain, in their own words, a pattern rule that represents the relationship between the number of movies rented and the cost for this site?
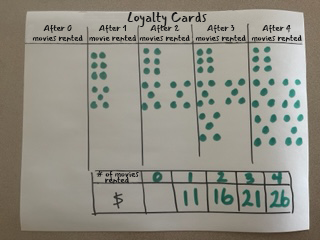
- Other teams may present their report by hiding certain elements, for example, the loyalty card showing 0 rented movies and the term under the 0 in the table of values (see photo below). By asking questions, team members lead other students to identify the hidden items and establish the pattern rule that represents the relationship in this scenario.
Encourage students to respond to each presentation and to share their observations or questions. Facilitate the mathematical conversation by asking questions as needed such as:
- When you received your scenario, which representation did you start with (manipulatives, stamps, table of values)?
- Who is willing to explain in their own words the layout of the points on the loyalty cards just presented?
- Did you use any manipulatives before representing your scenario on your loyalty cards? If so, did it make the task easier?
- These two teams had the same scenario, but their loyalty cards are different. How can we justify that they both represent this scenario?
- Under the scenario just discussed, what would the loyalty card look like after six movies rented? ten movies rented?
- How is the number of points on other loyalty cards determined? What pattern rule represents the relationship?
Differentiated Instruction
The activity can be modified to meet the needs of the students.
| To Facilitate the Task | To Enrich the Task |
|
|
Follow-up at Home
At home, students share the classroom learning context with a family member and then present the table of values below. Together, they compare costs and determine a pattern rule that represents the relationship between the number of movies rented and the cost at each site to answer the following questions:
- Which site is more advantageous for someone renting seven movies? (Site 1)
- Which site is more advantageous for someone renting 20 movies? (Site 2)
Site 1
| Number of Movies Viewed | 0 | 1 | 2 | 3 | 4 | 5 |
|---|---|---|---|---|---|---|
| Amount Spent ($) | 0 | 6 | 12 | 18 | 24 | 30 |
Site 2
| Number of Movies Viewed | 0 | 1 | 2 | 3 | 4 | 5 |
|---|---|---|---|---|---|---|
| Amount Spent ($) | 30 | 32 | 34 | 36 | 38 | 40 |
Source: translated from Guide d’enseignement efficace des mathématiques de la 4e à la 6e année, Modélisation et algèbre, p.145 -157.