C1.3 Determine pattern rules and use them to extend patterns, make and justify predictions, and identify missing elements in repeating and growing patterns.
Activity 1: Tree Growth
Ask students to represent the relationship between the age of the tree and its height using the following models:
- Table of values
- Graphic representation
- In words
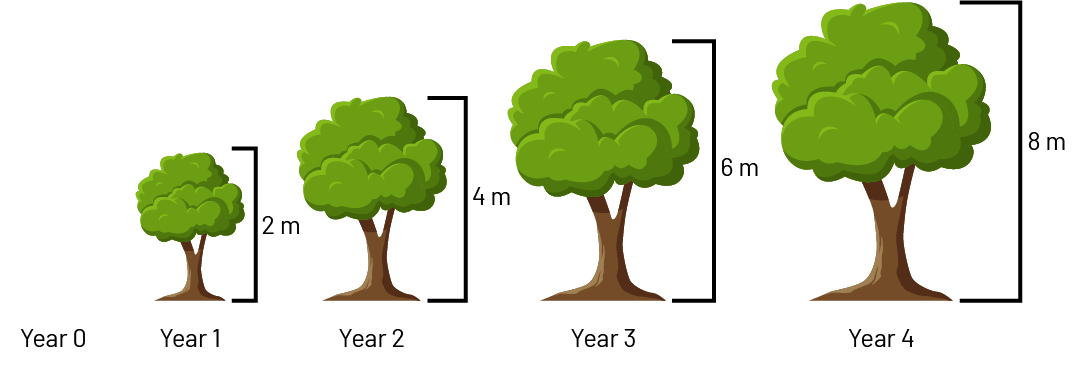 Image A term that shows tree growth in meters over 4 years. Year one, 2 meters. Year 2, 4 meters. Year 3, 6 meters. Year 4, 8 meters.
Next, invite students to answer the following.
- Describe the change in the values in the table of values.
- How is this change reflected in the graphic representation?
- How does the age of the tree change in the table of values?
- How does the height of the tree change in the table of values?
- What is the relationship between the height of the tree and its age?
- How tall will the tree be when it is 45 years old? Is this possible? Why or why not?
- Is there a pattern rule in this relationship?
- How does each representation (table of values, graphical representation, words) illustrate the pattern rule?
- If we wanted to represent the height of the tree at 45 years, what would the graph look like?
Source: translated from L’@telier - Ressources pédagogiques en ligne (atelier.on.ca).
Activity 2: A Square, Squares
Show students the following pattern and ask them to draw the fourth term.
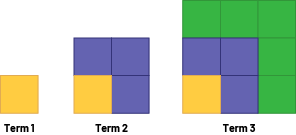 Image Non-numeric growing pattern of squares. Term one, one light blue square. Term two, one light blue square and 3 medium blue square. Term 3, one light blue square and 3 medium blue square, and 4 dark blue squares.
Invite students to determine the pattern rule and use it to draw the fifth term.
Ask students to create a table of values that represents the relationship between the term number of the term and the corresponding count of squares within each term.
| Term Number | 1 | 2 | 3 | 4 | 5 | 6 |
|---|---|---|---|---|---|---|
| Number of Squares | 1 | 4 | 9 | 16 | 25 | ? |
To get students to analyze the relationship between the term number and the number of small squares within it, ask questions such as:
- What is the next entry in table of values for the number of square tiles? How did you determine this?
- How many small squares will be in the 10th position? in the 12th position? in the 20th position?
- What do you notice about all the numbers of square tiles in the table of values?
- Will any terms following this pattern have 15 squares tiles? 49 square tiles? 81 square tiles? 50 square tiles? Explain your answer.
- What is the relationship between the term number of the term and the number of small squares within each term?
To help students to recognize that the number of square tiles that make up a term always corresponds to the square of the term number (or the area of the term), read the values from the table aloud (6, 36; 5, 25; 4, 16…).
Encourage students to look at the term by the number of rows or columns (for example, the 3rd term has 3 rows of 3 squares or 3 columns of 3 squares) or to think about multiplication facts.
Source: translated from Guide d’enseignement efficace des mathématiques de la 4e à la 6e année, Modélisation et algèbre, p. 158-159.