C1.2 Create and translate repeating and growing patterns using various representations, including tables of values and graphs.
Skill: Creating Repeating and Growing Patterns
Before creating patterns, students must first recognize, compare, describe, change the representation, and extend a wide variety of patterns.
Example
Students demonstrate their understanding of the concept of a rule by creating a pattern and explaining it.
When students use manipulatives to create patterns they can easily change one element of the pattern and check the rule.
Initially, teachers have students work in small groups to encourage the exchange of ideas. They can provide them with the attributes and structure of the pattern, as well as the materials required to create it.
During a mathematical discussion (consolidation/debrief), presentations of the patterns help to identify different representations of the same rule and to check how students communicate their understanding.
Next, students can be asked to create a pattern and exchange it with a peer. They can then construct a different representation of the received pattern, describe its structure, extend it, or produce a completely different one for comparison. The number of elements in the pattern should be limited, however, as some students use too many, making it difficult to understand the structure of the pattern.
Source: translated from Guide d’enseignement efficace des mathématiques de la maternelle à la 3e année, Modélisation et algèbre, Fascicule 1, Régularités et relations, p. 39-40.
Skill: Representing Patterns and Making Connections Between Different Representations
When students make connections betweeen the different representations they are deepening their understanding about a pattern. When students express their understanding of a problem situation or concept and defend their ideas using different representations they are demonstrating their algebraic reasoning.
Modes of representations
- concrete, related to exploration, manipulation and creation using concrete materials;
- visual or semi-concrete, connected to an illustration, drawing or any other representation on paper;
- symbolic, linked to any representation made with numbers or symbols;
- “with words”, related to a verbal or written explanation or description.
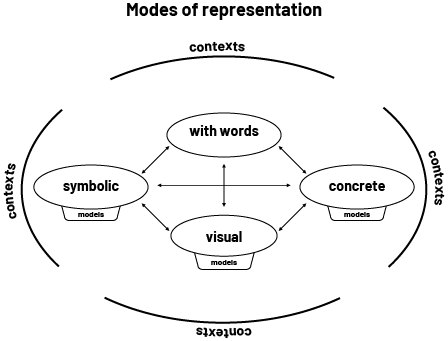 Image Schematic graphs show that students may use a variety of modes of representation. Mathematical relationships can be represented using concrete or semi-concrete materials, symbols, or oral descriptions.
Source: translated from Guide d’enseignement efficace des mathématiques de la 4e à la 6e année, Modélisation et algèbre, p. 18.
Contexts allows students to make connections between the various representations.
In the junior grades, students explore patterns and represent them in different ways. In Grade 4, students learn that a growing pattern can be represented by a situation (non-numeric pattern), a word rule, a table of values, or a graphical representation. The arrows in the graph below show the connections between these representations.
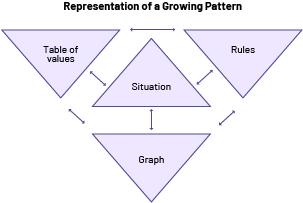 Image Computer graphics of representations of a relationship. The following elements are categorized in a triangle: value table, situation, rules in words, and graphic representation. They are interrelated with interchangable arrows.
Source: translated from Guide d’enseignement efficace des mathématiques de la 4e à la 6e année, Modélisation et algèbre, p. 41.
Using multiple representations of the same pattern to communicate understanding is an essential component of developing algebraic thinking.
Describing a growing pattern
When students are presented with a growing pattern, teachers should provide them with a variety of opportunities to describe it in words. This is an essential step in getting students to determine the algebraic expression of the pattern.
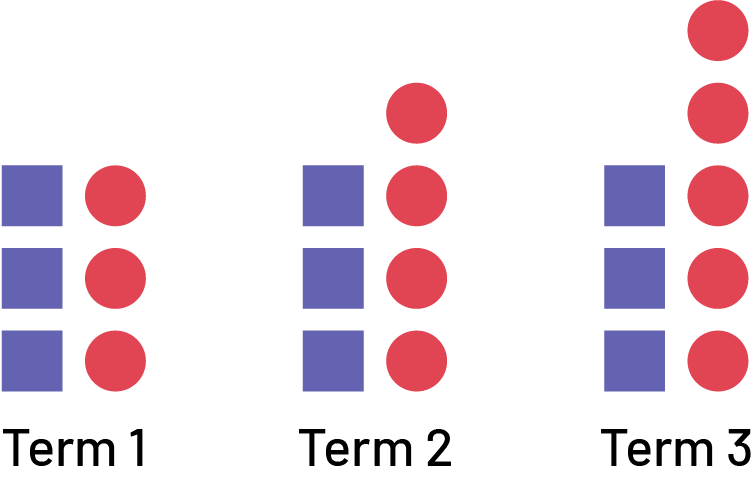 Image Non-numeric pattern with growing patterns. Term one, 3 squares and three circles. Term 2, 3 squares and four circles. Term 3, 3 squares and 5 circles.
The growing pattern can be described as follows:
Term 1 is composed of 3 blue squares and 3 red circles.
Term 2 is composed of 3 blue squares and 4 red circles.
Term 3 is composed of 3 blue squares and 5 red circles.
Students may also notice that the number of blue squares, 3, remains constant, while the number of red circles increases by 1 for each term.
Representing a situation using words
In a problem-solving context, students can represent a situation in words.
Present the following situation to the students:
A new video viewing website, Film Plus, is now available. A subscription fee of $4 is required to view the first video. The costs of renting one movie, two movies, three movies and four movies are $9, $14, $19 and $24.
Students can model the situation as well using concrete or semi-concrete materials to support their words. In the diagram, the four red circles represent the subscription cost and the blue circles make up the other portion of the cost to rent a movie.
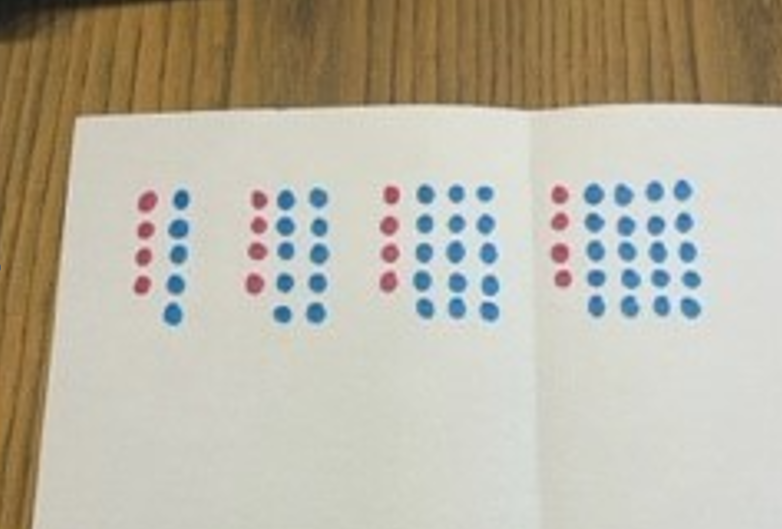 Image Geometric growing patterns. term 1, four red circles and 5 blue circles. term 2, 4 red circles and 10 blue circles. term 3, 4 red circles and 15 blue circles. term 4, 4 red circles and 20 blue circles.
|
If you rent 1 movie, you have to pay a $4 subscription fee and 1 × $5, so you pay $9. |
Source: translated from Guide d’enseignement efficace des mathématiques de la 4e à la 6e année, Modélisation et algèbre, p. 51.
Manipulatives
Examples of manipulatives include algebraic tiles, nesting cubes, tokens, relational rods. Students can use them to create and explore patterns.
Representing a Growing Pattern Using Manipulatives
Have students represent the 2, 6, 10, 14… number pattern in a concrete way to make the pattern rule more visible, by creating a growing pattern using manipulatives of their choice. Encourage them to add materials (cubes, tokens, etc.) in the same way from one term to the next and to rearrange them as needed.
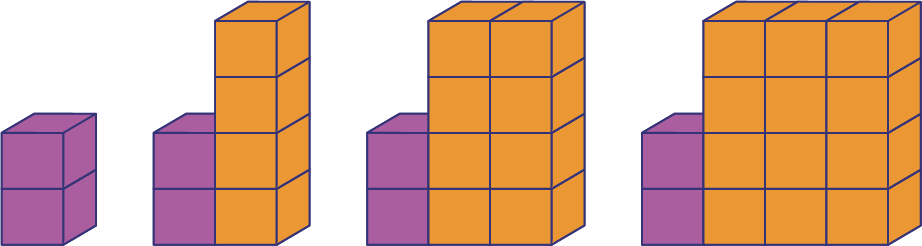 Image Non-numeric pattern with growing patterns. term one, 2 violet blocks. term 2. 2 violet blocks and 4 orange blocks. term 3, 2 violet blocks and 8 orange blocks. term 4, 2 violet blocks and 12 orange blocks.
Source: translated from Guide d’enseignement efficace des mathématiques de la 4e à la 6e année, Modélisation et algèbre, p. 212.
Relevant Questions
- How many cubes (tokens, blocks) will you use to concretely represent the first term of the pattern? The second? The third?
- What change do you notice from one term to the next?
- What remains the same from one term to another (the constant)?
- Are your cubes added the same way from one term to the next?
- How would you describe the appearance of the next term in this growing pattern?
- How many cubes will the tenth term contain? How can you determine this?
- What is the pattern rule? How do you know?
Illustration
Drawing an illustration allows students to create a semi-concrete personal representation of their observations and understanding.
Many types of problems are naturally suited for students to draw a picture to help them solve the problem. Students may also use manipulatives at the same time.
Representing a Growing Pattern Using an Illustration
Simon wants to buy a toy, but he doesn't have enough money in his piggy bank. His parents decide to give him the same amount of money every week, which he deposits in his piggy bank. In order to keep track of the amount of money in his piggy bank, Simon has created the following table of values:
| Weeks | 1 | 2 | 3 | 4 | … | … |
|---|---|---|---|---|---|---|
| Amount in the Piggy Bank ($) | 5 | 10 | 15 | 20 | … | … |
Ask students to illustrate the situation and determine how much money the parents give him each week.
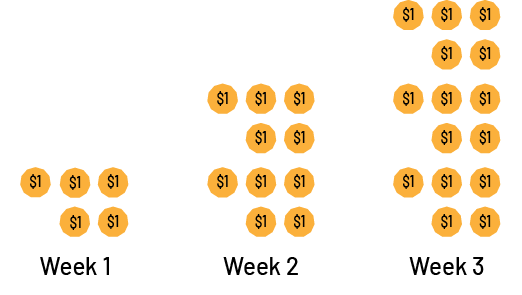 Image Illustration of amount of money received in a week. Week 1, 5 dollars. Week 2, ten dollars, Week 3, 15 dollars. Week 4, 20 dollars.
Relevant Questions:
- How does the illustration help determine the pattern rule?
- How much money will Simon have in his piggy bank in week 5? How do you know?
- How can you determine the amount of money in the piggy bank after a large number of weeks, for example, week 10?
- After how many weeks will Simon have enough money to buy a video game for $45 (including taxes)?
Source: translated from Guide d’enseignement efficace des mathématiques de la 4e à la 6e année, Modélisation et algèbre, p. 214-215.
Table of Values
A table of values is a semi-concrete representation showing the relationship between two changing quantities (variables), one of which depends on the other. It is often constructed to represent the relationship between numerical values associated with the terms of a growing pattern.
Representing the Relationship Between Two Changing Quantities Using a Table of Values
Present the following growing pattern:
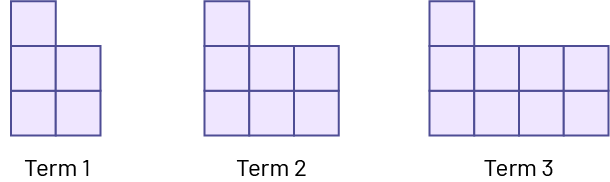 Image Non numeric pattern with growing patterns. Term one, 5 squares. Term 2, 7 squares. Term 3, 9 squares.
Ask students to create a table of values that represents the relationship between the term number and the number of squares.
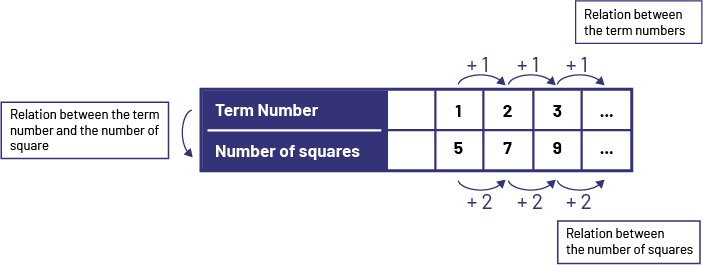 Image Table of values that represent the position of a term and the number of squares. Term one, 5 squares. Term 2, 7 squares, Term 3, 9 squares. Arrows are drawn to represent the bonds with values plus 2.
Relevant Questions
- Describe the relationships in the table of values.
- What is the value of the next terms?
- Describe the relationship between the geometric pattern and the table of values.
- What is the constant in the pattern? (Refer to the growing geometric pattern.)
Graphical Representation
A graph is a set of point (term number, term value) plotted on a coordinate system.
Represent the Relationship Between Two Changing Quantities Using a Graph
Present the following situation:
Last Saturday, during the marathon, Louis and Gaëlle sold lemonade. After each pitcher they sold, they counted the money they had received. The table of values below represents the relationship between the number of pitchers sold and the amount of money collected.
| Number of Pitchers Sold | 1 | 2 | 3 | … | … |
|---|---|---|---|---|---|
| Amount Collected ($) | 4 | 8 | 12 | … | … |
Then graph the data as shown below.
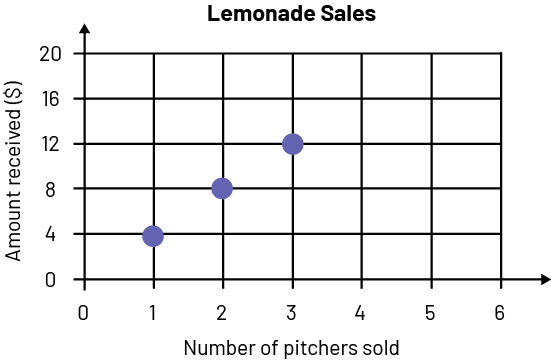 Image A graph that represents the number of pitchers sold and the sum received in dollars. One pitcher, 4 dollars. 2 pitchers, 8 dollars. 3 pitchers, 12 dollars.
Relevant Questions
- What changes occur from one pitcher sale to the next? Are these changes always the same? Why do they change?
- Looking at the graph, how is it possible to determine how much money they will have collected after selling an additional pitcher of lemonade?
- What is the relationship between the number of pitchers sold and the amount collected?
- How can the first three values shown in the graph help determine the amount of money collected after eight pitchers are sold?
- How many pitchers should they sell if they want to get about $50?
Represent the Relationship Between Two Changing Quantities Using a Bar Graph
Present students with the following scenario:
Edenville rents garden plots to members of its community. A garden the size of one square of land has a perimeter of 4 metres, a garden the size of 2 squares of land has a perimeter of 6 metres, three tiles a perimeter of 8 metres, and so on.
With the students, represent the gardens with drawings.
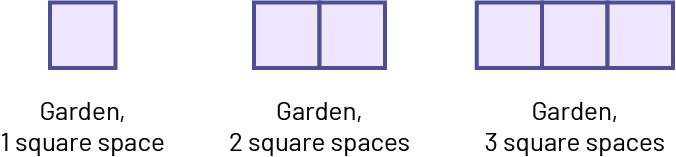 Image Non-numeric pattern with growing patterns. term one, garden of one square space. term 2, garden of 2 square space. term 3, garden of 3 square space.
Using a table of values, represent the relationship between the the number of square spaces a garden occupies and its perimeter.
| Number of Square Spaces | Perimeter (m) |
|---|---|
| 1 | 4 |
| 2 | 6 |
| 3 | 8 |
Then graph the data as shown below.
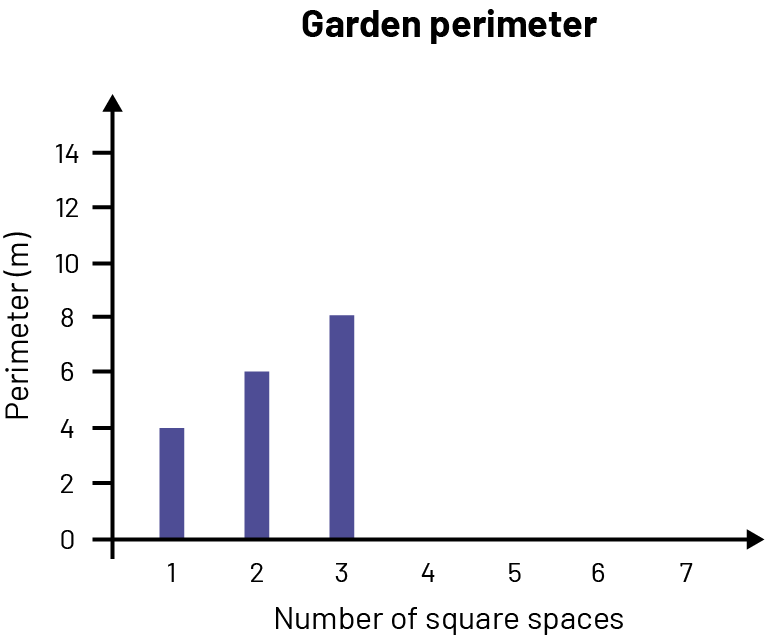 Image A graph that represents the number of square space and perimeter in meters of a garden. One square, 4 meters. 2 squares, 6 meters. 3 squares, 8 meters.
Relevant Questions
- What change is there between the values of the number of square spaces? Between the values of the perimeters? Explain your reasoning.
- What would be the next entries in the table of values?
- What is the relationship between the number of square spaces a garden occupies and the perimeter of the garden?
- How could you use the graph to determine the perimeter of an 8 square space garden?
- How many square spaces does a garden with a perimeter of 16 m occupy?
Source: translated from Guide d’enseignement efficace des mathématiques de la 4e à la 6e année, Modélisation et algèbre, p. 231-235.
Knowledge: Table of Values
The table of values is a numerical representation of the relationship between two variables, in which one variable is independent and the other variable is dependent. By the end of the primary grades, students have learned to create tables of values to represent relationships in problem situations.
The table of values is often created to represent the functional relationship between two numeric values associated with a non-numeric growing pattern: the term number and the corresponding value of the terms.
Example
It is possible to study the relationship between the position of a term in a growing pattern and the number of objects that compose it. The position of the term is written in the first column (or row) and the number of objects that make up the term (term value) is written in the second column (or row). The regularity rule of the terms in the second column (or row) can be used to extend the table of values.
The table of values can be arranged vertically or horizontally and is separated into columns or rows. It is a good idea to vary the layout of the table of values so that students get used to both layouts.
Vertical Table of Values
| Term Number | Number of Objects |
|---|---|
| 1 | 2 |
| 2 | 4 |
| 3 | 6 |
| 4 | … |
Horizontal Table of Values
| Term Number | 1 | 2 | 3 | … |
|---|---|---|---|---|
| Number of Objects | 2 | 4 | 6 | … |
Source: translated from Guide d’enseignement efficace des mathématiques de la 4e à la 6e année, Modélisation et algèbre, p. 231.
Knowledge: Graphical Representation
The term numbers are represented on the horizontal axis. The term value is represented on the vertical axis. The term value for term 0 is a point on the vertical axis.
Source: translated from Guide d’enseignement efficace des mathématiques de la 4e à la 6e année, Modélisation et algèbre, p. 63.
Example
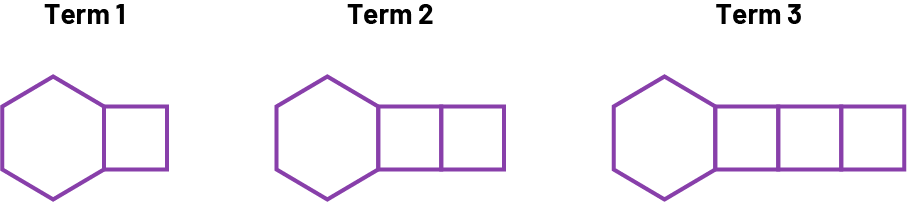 Image Graphic representation of Non-numeric growing pattern. Term one has a hexagon and one square. Term 2 has a hexagon and 2 squares. Term 3 has a hexagon and 3 squares.
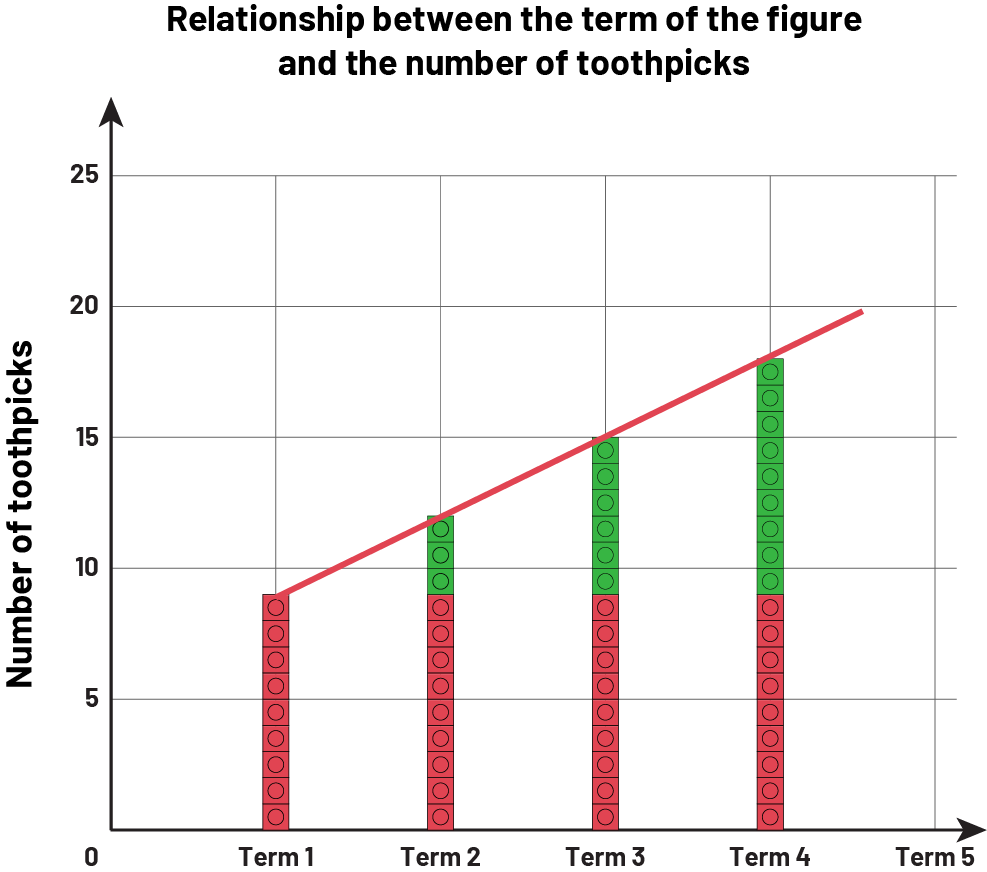 Image Graphic representation of Non-numeric growing pattern by the relationship between the position of the term and the number of toothpicks. Term one, 9 red cubes. Term 2, 9 red cubes and 3 green cubes. Term 3, 9 red cubes and 6 green cubes. Term 4, 9 red cubes and 9 green cubes. Term 5 empty.